NMS-3D

3D Non-Maximum Suppression

PyPI version


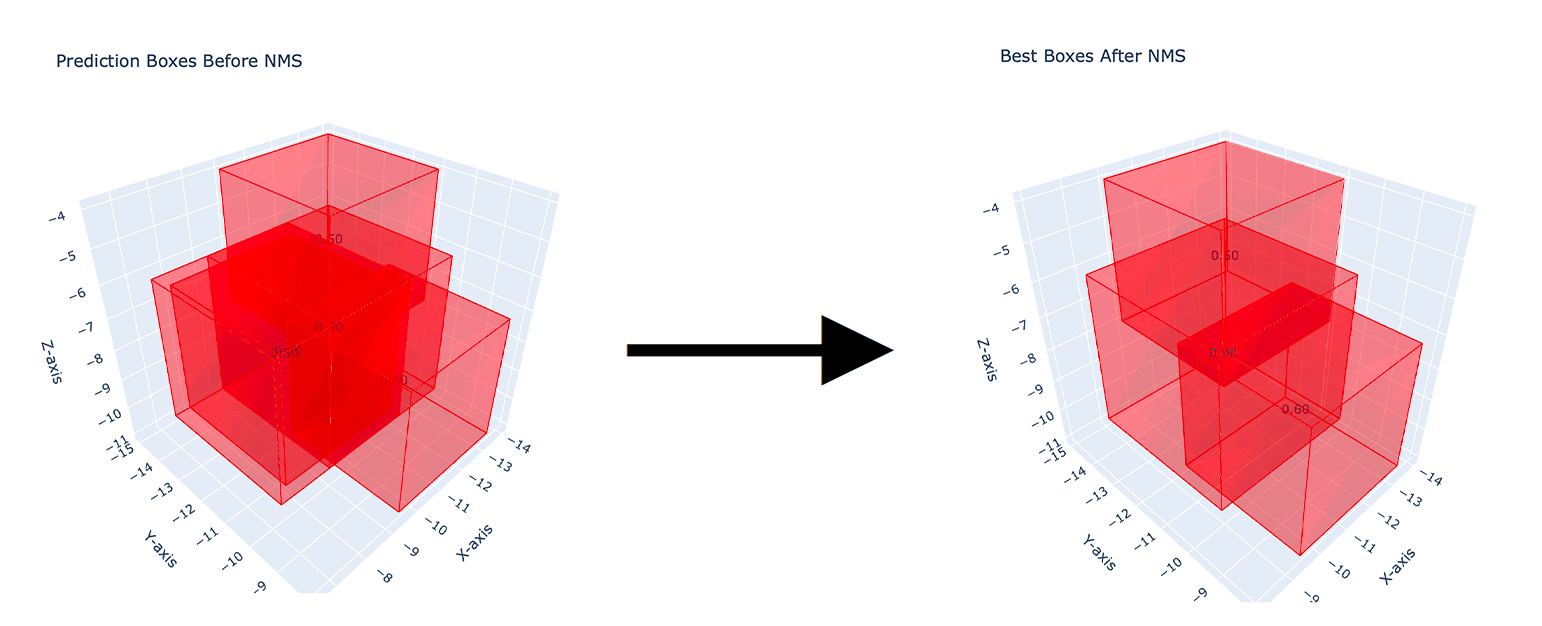
Implementation of 3D non-maximum suppression (NMS-3D) for bounding boxes using PyTorch and Plotly.

Example

⬇️ Installation and Import

Now, this code is available with PyPI at https://pypi.org/project/nms-3d/. The package can be installed with:

pip install nms-3d

and can be imported as:

import nms_3d

πŸ“‚ Project Organization

The project consists of the following Python modules:

.
β”œβ”€β”€ nms_3d/                # The NMS 3D package folder
β”‚   β”œβ”€β”€ nms_3d.py          # Function that applies the NMS 3D algorithm.
β”‚   └── plot_3d_boxes.py   # Function for creating 3D plots of bounding boxes using Plotly.
β”‚
β”œβ”€β”€ example.py             # The script that contains the 3D NMS application example.
β”‚
β”œβ”€β”€ bbox-coords/           # The folder that contains the bounding box .csv files before and after the 3D NMS.
β”‚   β”œβ”€β”€ bbox-coords-before-nms-3d.csv  # Example file of bounding boxes to suppress.
β”‚   └── bbox-coords-after-nms-3d.csv   # Output file after applying the 3D NMS on bbox-coords-before-nms-3d.csv.
β”‚
└── output/                # The folder that contains the .html visualization of the boxes before and after the 3D NMS.
    β”œβ”€β”€ best_boxes_after_nms.html   # .html view of the boxes after the 3D NMS.
    β”œβ”€β”€ best_boxes_before_nms.html  # .html view of the boxes before the 3D NMS.
    └── NMS-image-example.png       # Example image used in this README.md file.

Run the application example with:

python3 example.py

This code will read the bounding box coordinates from bbox-coords-before-nms-3d.csv, perform 3D NMS, and save the result to bbox-coords-after-nms-3d.csv. Also, two 3D plots are saved as HTML files to show the boxes before and after NMS.

πŸ“¦ Package documentation

nms_3d

Apply 3‑D Non‑Maximum Suppression (NMS) to a set of scored axis‑aligned boxes. The function keeps the highest‑scoring box, removes all boxes whose IoU with it exceeds a chosen threshold, then repeats until no boxes remain.

nms_3d(
    prediction_boxes: torch.Tensor,
    iou_threshold: float = 0.5,
    debug: bool = False
) -> torch.Tensor

Parameters

Name Type Description
prediction_boxes torch.Tensor Shape (N,β€―7). Columns: SCORE, X_MIN, Y_MIN, Z_MIN, X_MAX, Y_MAX, Z_MAX.
iou_threshold float IoU cutoff for suppression (0β€’1). Default 0.5.
debug bool If True, prints each suppression step.

Returns

torch.Tensor – The retained boxes after NMS, shape (M,β€―7) where M ≀ N.

Example

import torch
from nms_3d import nms_3d

prediction_boxes = torch.tensor([
    [0.95, 10, 10, 10, 20, 20, 20],  # kept
    [0.90, 12, 12, 12, 22, 22, 22],  # suppressed (overlaps first)
    [0.85, 50, 50, 50, 60, 60, 60],  # kept
    [0.80, 55, 55, 55, 65, 65, 65],  # suppressed (overlaps third)
    [0.75,100,100,100,110,110,110]   # kept
])

filtered = nms_3d(
    prediction_boxes=prediction_boxes,
    iou_threshold=0.5,
    debug=True
)
print(filtered)

plot_3d_boxes

Visualise axis‑aligned 3‑D bounding boxes with Plotly and (optionally) save the interactive scene to HTML.

plot_3d_boxes(
    boxes: torch.Tensor,
    title: str = "Plot 3D boxes",
    save_html: bool = False,
    html_filename_path: str | None = "./plot_3d_boxes.html",
    color: tuple[int, int, int] = (255, 0, 0),
    show_scores: bool = True
) -> None

Parameters

Name Type Description
boxes torch.Tensor Shape (N,Β 7) – columns: SCORE, X_MIN, Y_MIN, Z_MIN, X_MAX, Y_MAX, Z_MAX.
title str Window title for the Plotly figure.
save_html bool True β†’ write the figure to html_filename_path; False β†’ open an interactive window.
html_filename_path str Output path for the .html file (used when save_html=True).
color tuple[int,int,int] RGB triplet for box edges/faces.
show_scores bool Display each box’s confidence score at its centroid.

Returns

None – renders the figure or writes it to disk.

Example

import torch
from nms_3d.plot_3d_boxes import plot_3d_boxes

boxes = torch.tensor([
    [0.95, 10, 10, 10, 20, 20, 20],
    [0.85, 30, 30, 30, 40, 40, 40],
    [0.75, 50, 50, 50, 60, 60, 60]
])

plot_3d_boxes(
    boxes=boxes,
    title="Bounding Boxes",
    save_html=True,
    html_filename_path="./boxes.html",
    color=(0, 255, 0),
    show_scores=True
)

🚨 Requirements

Python>=3.8.0
torch>=2.2.2
plotly>=5.13.1

Install the requirements with:

pip3 install -r requirements.txt

🀝 Contribution

πŸ‘¨β€πŸ’» Ciro Russo, PhD

βš–οΈ License

MIT License